So, you're running a lead gen thing in 2025 and using ping post (or thinking about it). You're probably wondering, Are we doing this right?
Like, are you quick enough on the draw? Getting enough offers? Spending the right amount per lead?
Well, ping post is all in the details. Once you figure out what numbers matter and where they should be, you can actually improve stuff instead of just guessing.
Let's get into it.
🚦What Is “Good” in Ping Post?
Okay, good changes based on what you're selling. What's awesome for life insurance might suck for solar. But usually, the best ping post setups in 2025 look something like this:
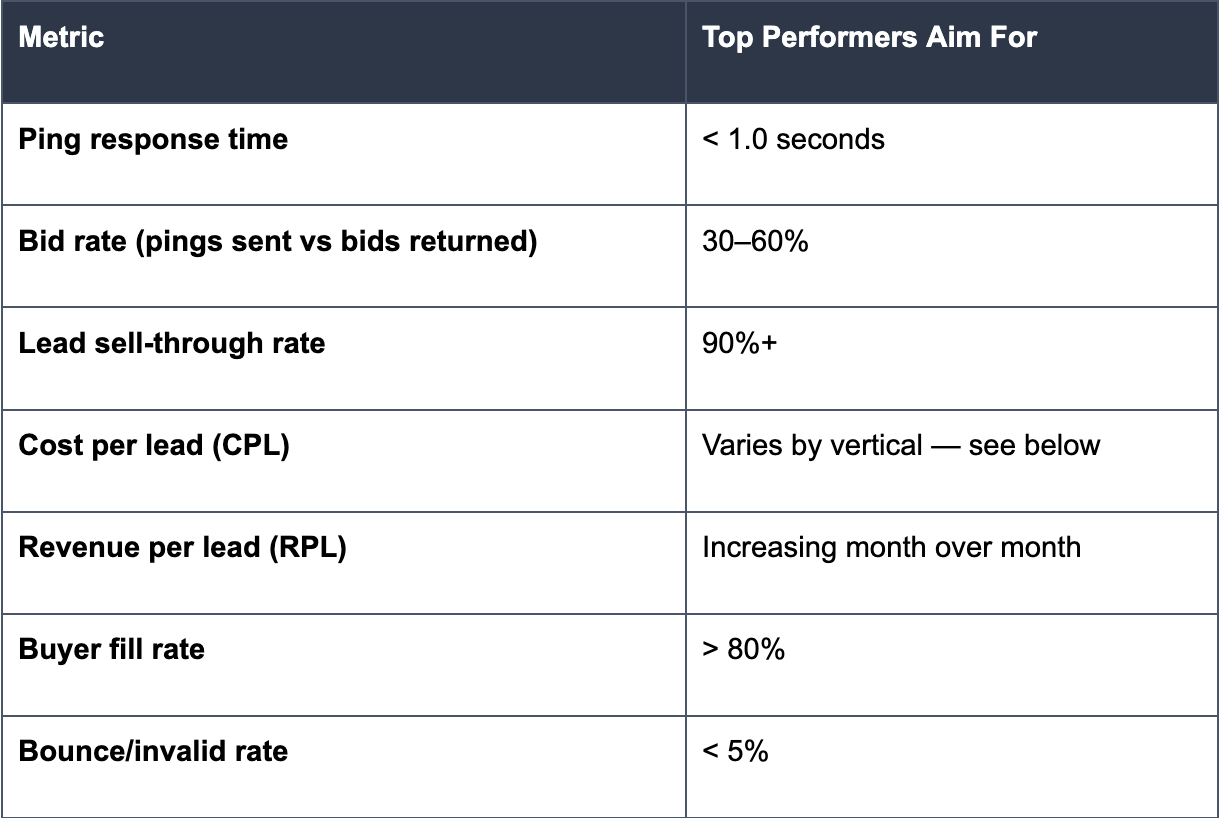
If you're below these numbers, chill. It just means you should see what's up.
🧭 Cost Per Lead & Revenue Per Lead by What You're Selling (2025-ish)
These numbers bounce around a lot, but here’s a general idea for now:
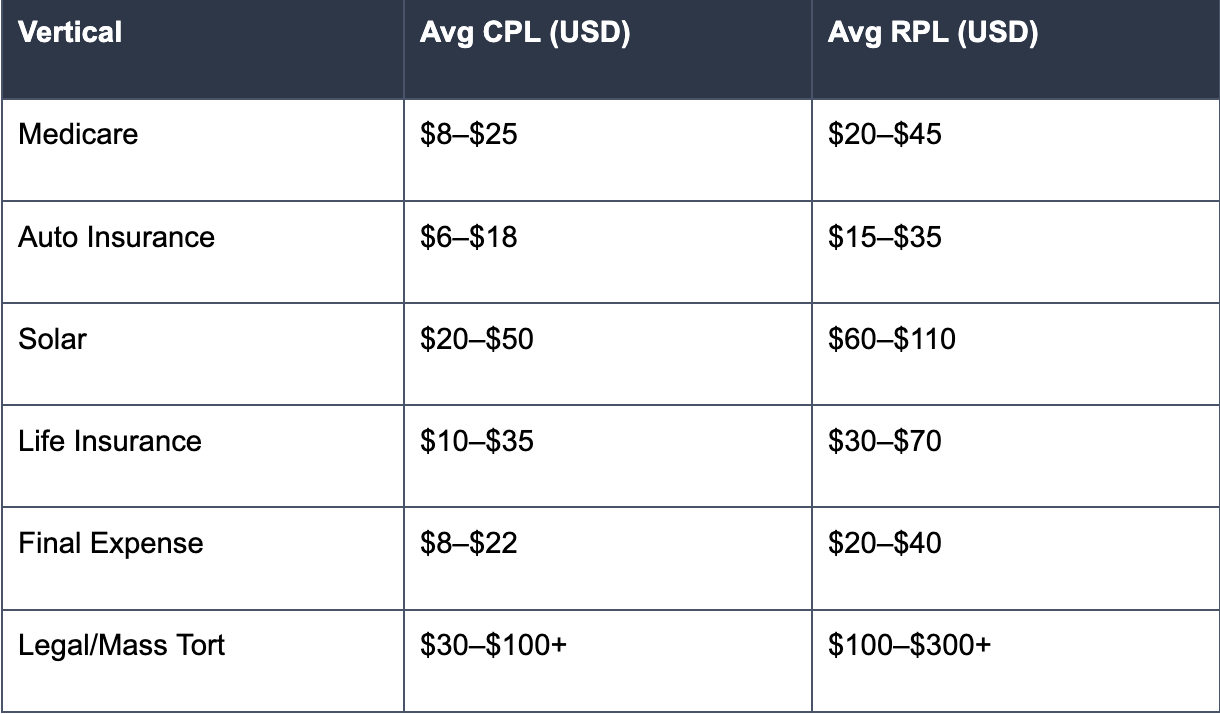
Just remember, these are broad averages. Your numbers might be higher or lower, depending on location, where the leads come from, the time of year, and who's buying.
🧠 Why Worry About These Numbers?
Think of these numbers as a map – they keep your lead sending on track.
If it takes you 2+ seconds to respond to a ping, buyers might get bored and leave. if only 10% of your pings get offers, you need to up your buyer game. if you're spending more than you making, rethink prices or those filters.
This is all makes the between growing your profits quickly, and wasting leads with bad results.
🧪 How to Check (and Make it Better)
Let’s go one by one:
📍 Ping Response Time
Aim for: Under 1.0 second
Why Does it Matter? Leads go bad fast. If your buyers can't react fast, someone else will.
How to Improve:
- Put buyers with fast tech first (API response under 500ms)
- Make your ping setup faster
- Have a backup plan if the best buyers don't bite fast enough.
📍 Bid Rate
Aim for: 30–60%
Why Does it Matter? It shows if your leads are good and if you're matching them to the right buyers.
How to Improve:
- Find more buyers in different spots or markets
- Give more detail in your pings (more info = better decisions)
- Group leads by where they came from or how good they are.
📍 Sell-Through Rate
Aim for: 90%+
Why Does it Matter? Leads you can't sell = lost money
How to Improve:
- Add backup buyers
- Change your routing based on the time of day
- Be stricter on lead checks to cut down on rejects
📍 Cost Per Lead vs Revenue Per Lead Spread
Aim for: Revenue Per Lead > Cost Per Lead, always
Why Does it Matter? That's your profit – it pays the bills.
How to Improve:
- Get buyers to bid higher (get more buyers)
- Get leads of better quality for higher Revenue Per Lead
- Use ping post instead of just sending directly
🛠 Platform Stuff That Helps You Track
The right lead distribution platform makes this way easier to monitor. Tools like Standard Information offer:
- Live dashboards (bid response times, fill rate, revenue per lead)
- Buyer-level performance reports
- AmeliaAI to help optimize campaigns in real time
- Compliance and filtering stats
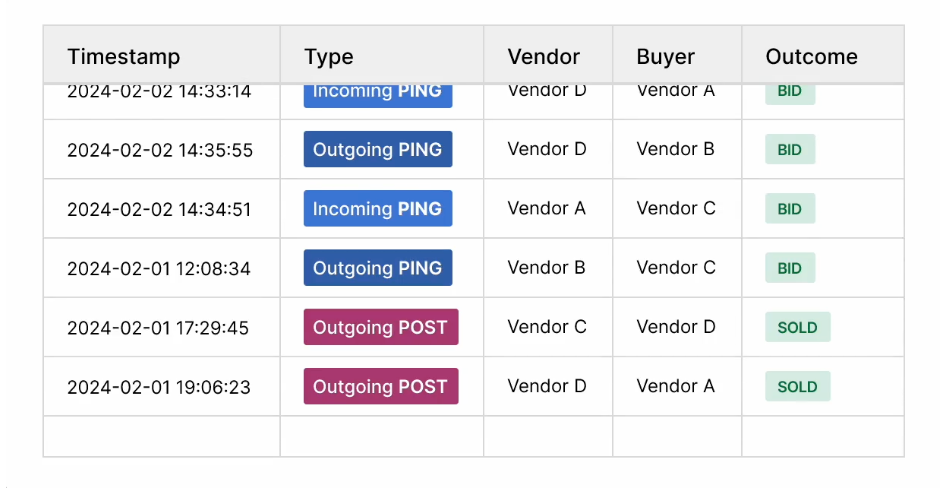
Tracking this manually? That’s rough. Let the platform do the heavy lifting.
🚫 Common Screw-Ups That Mess Up Numbers
Some common mistakes we see:
- Not enough buyers = Low bid rates
- Slow tech = High ping times
- No backup plan = Lower fill rates
- Messy lead = More rejects, fewer bids
- Bad vertical-pricing match = Poor Revenue Per Lead, even with good buyers
Sometimes, fixing just one thing can boost all your numbers.
🔍 These Numbers Aren't Everything, but You Should Still Look at Them
These numbers are guides, not rules. Use them as a compass.
Maybe your market is weirder. Maybe your leads are top-notch and sell for more. Good for you. Just make sure you're comparing similar things.
Whatever your numbers are, know them, track them, and make them better.
FAQs
Q: What’s a good ping response time in 2025? Under 1.0 second is ideal — anything above 2 seconds risks missing bids.
Q: What’s the average cost per lead for ping post? It varies by vertical. Medicare leads might be $8–25; solar could be $20–50+.
Q: How do I track these benchmarks? Use a lead distribution platform with real-time dashboards and buyer-level reporting.