Ping post lead distribution is one of the quickest, most flexible ways to sell leads. It lets you ping lead info to buyers, get bids, and send the lead to the best bidder.
But as your biz grows, speed isn't the only thing that matters.
Without analytics in your setup, you're flying blind:
- Which buyers are closing deals?
- Which sources are costing you money through refunds?
- Are your best leads going to the right people?
- Are your minimum bids too high, stopping good matches?
Ping post needs analytics to work well, not just as a fast system.
Why Analytics Matter When You Grow
When you have a small amount of leads, a few bad ones don't matter too much. But when you're dealing with thousands every day, every problem hurts.
Inefficiency looks like this at scale:
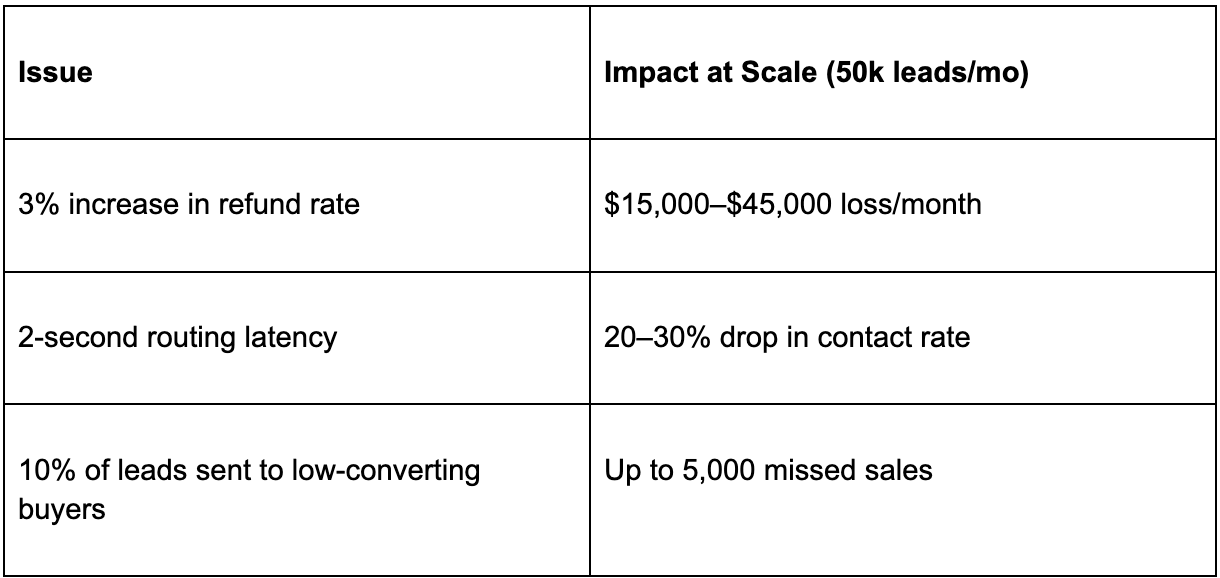
Analytics helps you spot and fix these issues before they drain your money.
The Analytics You Need
1. Bid Win Rate by Source and Score
This shows which sources give you leads that get high bids. You can:
- Focus on those sources when you buy media
- Raise prices for high-performing sources
- Get rid of sources that win bids but don't convert
2. Buyer Conversion and Refund Behavior
Ping post platforms usually just track bids. But with analytics, you can:
- Find the buyers with the best ROI (conversion rate × revenue)
- See which buyers give lots of refunds or don't contact leads
- Use this info to rank buyers – good buyers get better leads
3. Latency and Speed-to-Lead Monitoring
How fast you route leads matters. If a lead is delivered too late, it can go cold. With analytics, you can:
- Check how long each buyer takes to respond
- Automatically stop sending leads to slow buyers
- Track how long it takes to first contact and see how it impacts conversion
4. Revenue vs. Cost per Lead by Source
Not all leads are equal. You need to see:
- How much you paid per lead (CPL)
- How much you earned per lead (after refunds)
- Which sources make money vs. lose money
This is useful when working with affiliates.
How to Create a Feedback Loop
The goal is more than just analytics; it's using them to change your routing. Here's the loop:
- A lead enters your system with info: source, score, time.
- Analytics track response time, bids, refunds, contact rates.
- Rate buyers and sources based on on how they perform.
- Change routing rules: block bad performers, favor good paths.
- Make changes live regularly.
Platforms let you do this by putting analytics right into ping post routing.
Better Ping Tree with Analytics
Your ping tree (buyer order) shouldn't stay the same. With analytics, you can:
- Rank buyers by refund rate and conversion history, not just bid price
- Send high-score leads only to buyers who convert
- Use speed as a filter, not just price
- Have backup plans if buyers don't respond
This leads to money and fewer refunds.
Rating Sources and Campaigns
Give sources different treatment. You should be rating:
- Contact rate per source
- Refund amount
- Downstream sales info
- Net revenue per leads
This helps you spend money on the sources that perform.
Dashboards vs. Old Reports
Old lead systems gave reports later. Systems give:
- Dashboards
- Alerts based on your settings
- Bid, refund, and speed reports by buyer and source
- Detailed info down to the lead
You go from reacting to predicting.
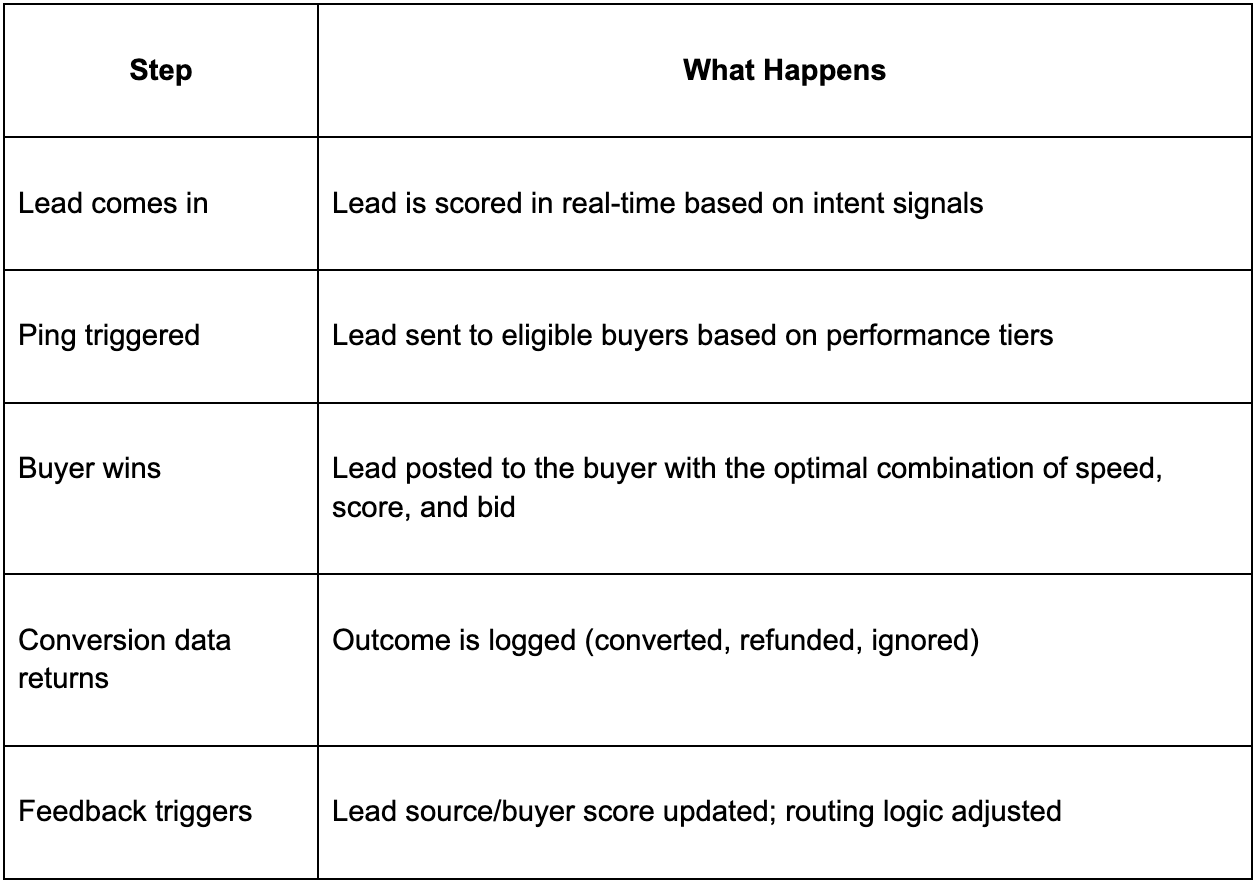
Analytics + Ping Post: How They Work Together
Here's how analytics and ping post combine:
The Biz Impact
Even small improvements matter:
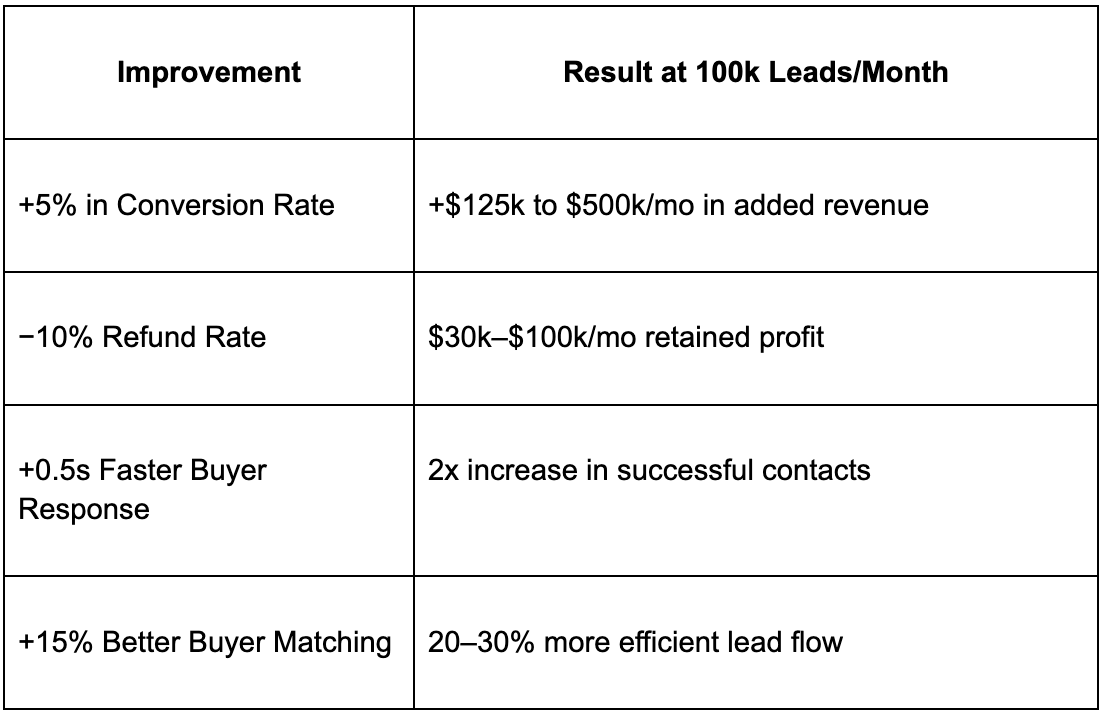
These aren't just ideas. are seeing these gains.
Key Things to Watch Each Week
If you're not watching these, you're losing money:
- Bid Win Rate
- Buyer Speed
- Conversion Rate
- Refunds
- Time to First Contact
- Lead Profit
- Compliance Pass Rate
Closing the Loop
A system enables you to:
- Combine analytics with ping-post
- Stop leads from bad sources
- Change traffic based on buyer conversion, refunds, and speed
- Performance
Analytics is part of your routing.
Final Thoughts: Analytics for Growth
The best ping post platforms are more than just distribution. They're fueled by analytics.
You can't grow without:
- Seeing performance
- Automated changes based on data
- Changing things based on buyer behavior
Analytics makes ping post a smart engine.
More Info:
- Standard Information – Ping Post Explained
- Standard Information – Lead Quality Overview
- Standard Information – Platform Capabilities
FAQs:
Q1: Why is analytics important in ping post lead distribution?
Analytics makes ping post a performance tool. It helps you see which buyers convert, which sources cause refunds, and where you lose money. Without analytics, sellers are blind, it can cost money.
Q2: What analytics should every ping post platform track?
You need:
- Bid win rate by source
- Buyer conversion and refund behavior
- Speed-to-lead
- Revenue vs. cost per lead
These analytics automatically improve lead flow.
Q3: How do analytics improve lead routing and revenue?
Analytics create a loop that adjusts routing. Leads go to buyers who convert, and bad sources are stopped. This means better conversion rates and ROI.
Q4: What makes an analytics-driven ping post system different?
Systems report results later. Platforms use dashboards to optimize routing. The result: faster, smarter, and better lead distribution.